Tuesday, Sept. 14, 2010 | 2 a.m.
Reader poll
Sun archives
- HUD secretary says Las Vegas housing market stabilizing (9-11-2010)
- Walking away from a mortgage comes with risks (9-3-2010)
- Analysts disagree on falling house prices (8-6-2010)
- From building boom to recessionary bust, local real estate market was a wild ride that went south (6-11-2010)
- Tax credit’s effect peters out, pointing to a lull in housing sales (5-13-2010)
- Bank foreclosures, delinquent mortgages continue to rise (5-12-2010)
- Tax credit’s end fails to help Las Vegas home sales (5-10-2010)
- Housing market awaits impact of tax credit’s expiration (5-7-2010)
- Las Vegas has more than its share of troubled properties (5-7-2010)
- Las Vegas posts nation’s highest metropolitan foreclosure rate (4-28-2010)
- Report: Decline in Las Vegas home prices slows (4-27-2010)
Sun Coverage
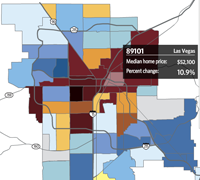
In some parts of the Las Vegas Valley, home prices have recently gone up — by double digits.
And even where prices went down from the second quarter of last year to the same quarter this year, it was mostly in higher-end subdivisions where prices had dropped the least in the past two years.
But the median price of the new and existing homes and condos in the valley remained steady at $135,000, according to San Diego-based DataQuick.
Year-over-year double-digit increases in home prices were reported for 15 of 57 ZIP codes in the second quarter of 2010.
Declines in median prices were reported for 30 of 57 ZIP codes, a trend that has slowed significantly, indicating that prices have stabilized, analysts said.
Double-digit declines were reported for only seven ZIP codes, compared with the 15 that reported double-digit increases.
In a reversal, areas that had the steepest declines have started to rebound while higher-end subdivisions and developments that had the smallest decline during the housing downturn had the biggest drop in the second quarter.
Double-digit price drops had been the norm, especially in North Las Vegas and older areas near downtown Las Vegas.
Dennis Smith, president of Homebuilders Research, said the market has been waiting for homes priced more than $250,000 to come down. Many homeowners had been reluctant to drop their prices and many are probably realizing that they must do so to sell, Smith said.
In addition, Smith said lenders are more willing to approve short sales of higher-priced homes rather than have them go into foreclosure.
“I think it would tell us that maybe banks are starting to move on a broader range of properties,” Smith said.
DataQuick reported that the 14,246 sales in Clark County, which includes Laughlin and Mesquite, represented a 2.7 percent decrease from the second quarter of 2009.
The drop in sales for the second quarter came as DataQuick reported that July sales were down the most year-over-year in more than two years. That is attributed to the expiration of federal tax credits for homes under contract by the end of April.
DataQuick reported 4,310 new- and existing-home sales closed escrow in July, down 22 percent from June and 19 percent from July 2009.
That was the biggest year-over-year decline since sales fell 19.7 percent in April 2008. And it was 12 percent below the average for the month since 1994, DataQuick spokesman Andrew LePage said.
The median price for new and existing homes in July was $129,000, down 7 percent from $139,000 in June and nearly 1 percent from $130,000 in July 2009.
By DataQuick’s calculation, the median price was 58.4 percent below the peak of $312,000 in November 2006.
The median price paid for existing homes was $76 per square foot in July, up 1.3 percent from July 2009. That is the fourth consecutive month in which that price didn’t fall year-over-year. Before that, the median paid per square foot had declined year-over-year each month since late 2006.
July’s figure was 60 percent below the July 2006 peak of $190 per square foot.
“I have been suggesting that by the end of this year we will start to see prices (of existing homes) level off and might even show an increase,” Smith said.
Smith said sales numbers are off not only because of the expired federal tax credit but because inventory has dwindled. That creates more competition for the homes among investors and other buyers, he said.
Investors made up a larger share of the buyers in July after many first-time buyers went to the sidelines with the end of the tax credit.
Absentee buyers bought 44.5 percent of the homes in July, up from 37.5 percent in June, LePage said. Cash buyers accounted for 48.4 percent of sales, up from 42 percent in June. The median price paid for the all-cash deals in July was $108,000, up from $106,375 in June and up from $89,250 in July 2009.
In July, 3.6 percent of all homes sold were flipped, meaning they had also been sold during the prior six months. That is up from 3.4 percent in June and 2.9 percent in July 2009.
The area’s flipping rate peaked in September 2004 at 9 percent.
Join the Discussion:
Check this out for a full explanation of our conversion to the LiveFyre commenting system and instructions on how to sign up for an account.
Full comments policy